Artie can send the same metrics to Datadog or Grafana Cloud, where you can build your own dashboards and monitors.
Available filters
For each of these metrics, you also have the ability to set a filter:- Pipeline (All or a specific pipeline)
- Specific tables (This is available if you specify the pipeline)
- Whether to include or exclude backfills
- Mode (Replication or history)
Metrics
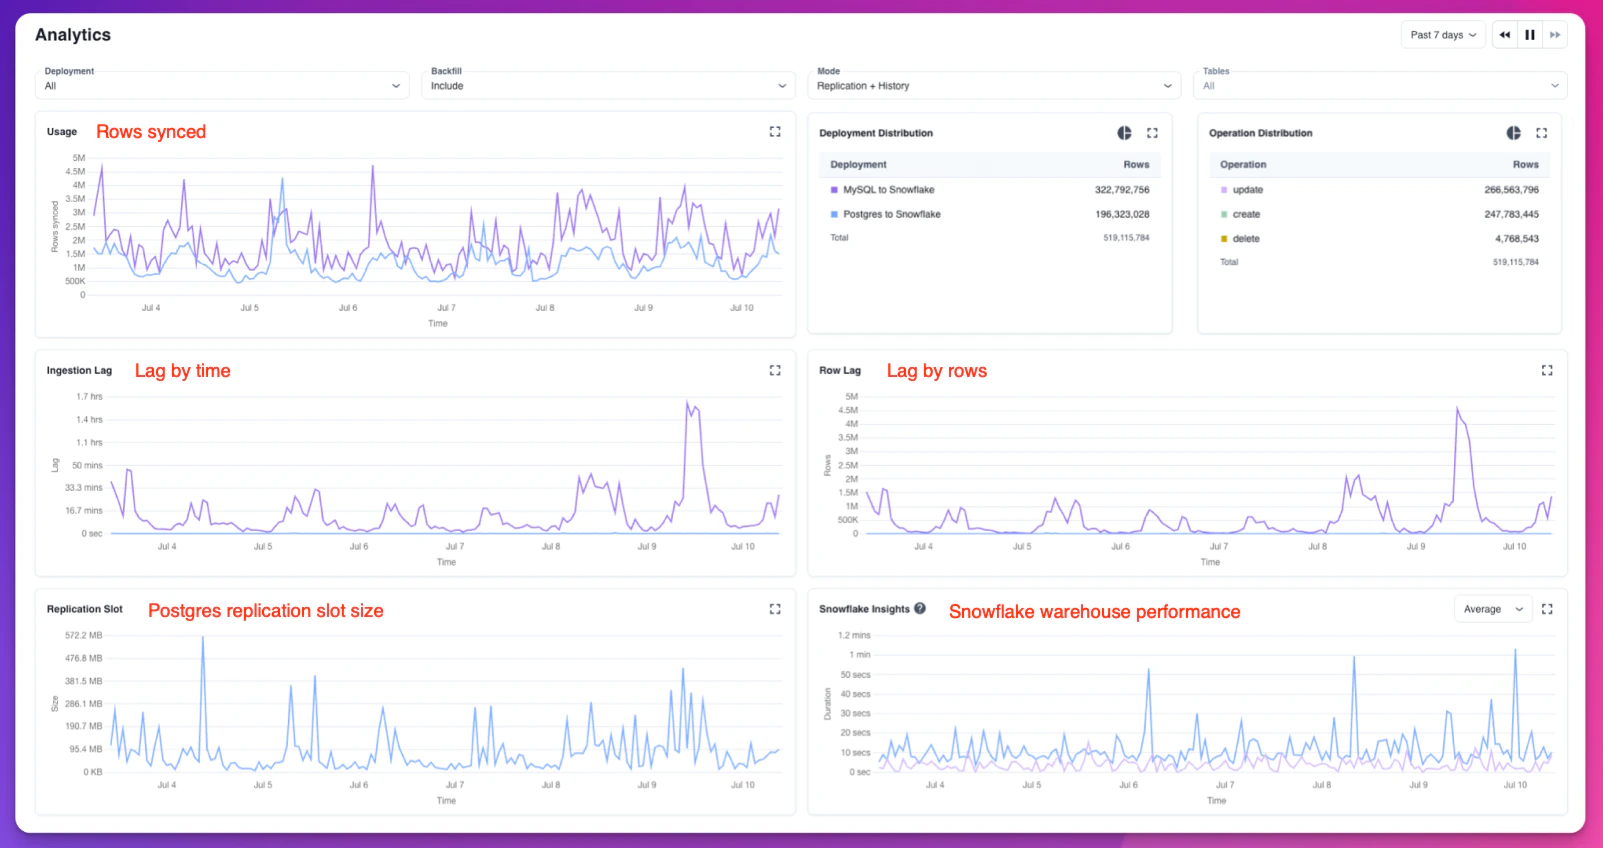
The following metrics are available in the Analytics Portal:- Rows synced over time
- Type of operation (create, update, delete, backfill)
- Table distribution
- Ingestion lag based on time
- Ingestion lag based on number of rows
- For Postgres, we’ll also graph your replication slot size
- For Snowflake, we’ll monitor your virtual warehouse’s queued and execution time