

Datadog
For Datadog setup instructions and the available metrics, see the Artie integration in Datadog.
Grafana Cloud Metrics
Connect Grafana Cloud Metrics to send the same pipeline metrics available in Artie to your Grafana Cloud account. Artie sends metrics with Prometheus remote write; you do not need to run Prometheus, Grafana Alloy, or a collector.What you’ll need
- A Grafana Cloud stack with a Metrics instance.
- A Grafana Cloud access-policy token with permission to write metrics.
- Company admin access in Artie.
Create Grafana Cloud credentials
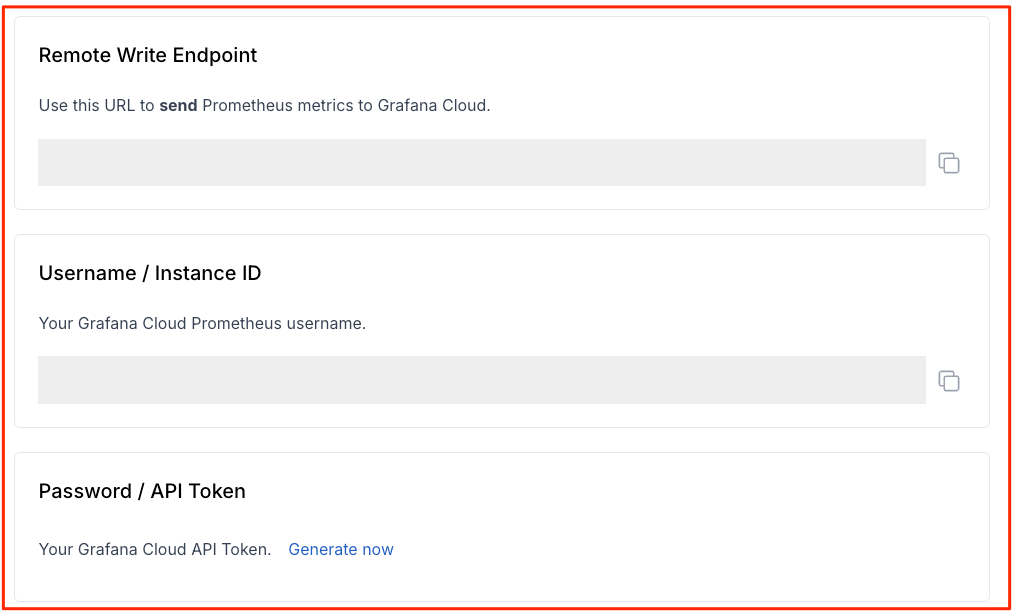
- In Grafana Cloud, open your stack and select the Prometheus or Metrics card.
- Select Details and copy the Metrics remote-write URL and Metrics instance ID.
- Create an access-policy token that can write metrics, then copy the token.
/api/prom/push.
Connect Grafana Cloud in Artie
1
Open integrations
In Artie, open Settings and select Integrations.
2
Enter Grafana Cloud credentials
Under Grafana Cloud Metrics, enter the remote-write URL, Metrics instance ID, and access-policy token.
3
Connect
Select Connect. Artie stores the access-policy token encrypted at rest and does not display it after connection.
artie_* metrics in Grafana Cloud. Artie sends the existing pipeline metrics and dimensions, including pipeline, source, destination, data plane, table, operation, flush reason, and replication-slot labels when available.
Import the Artie dashboard
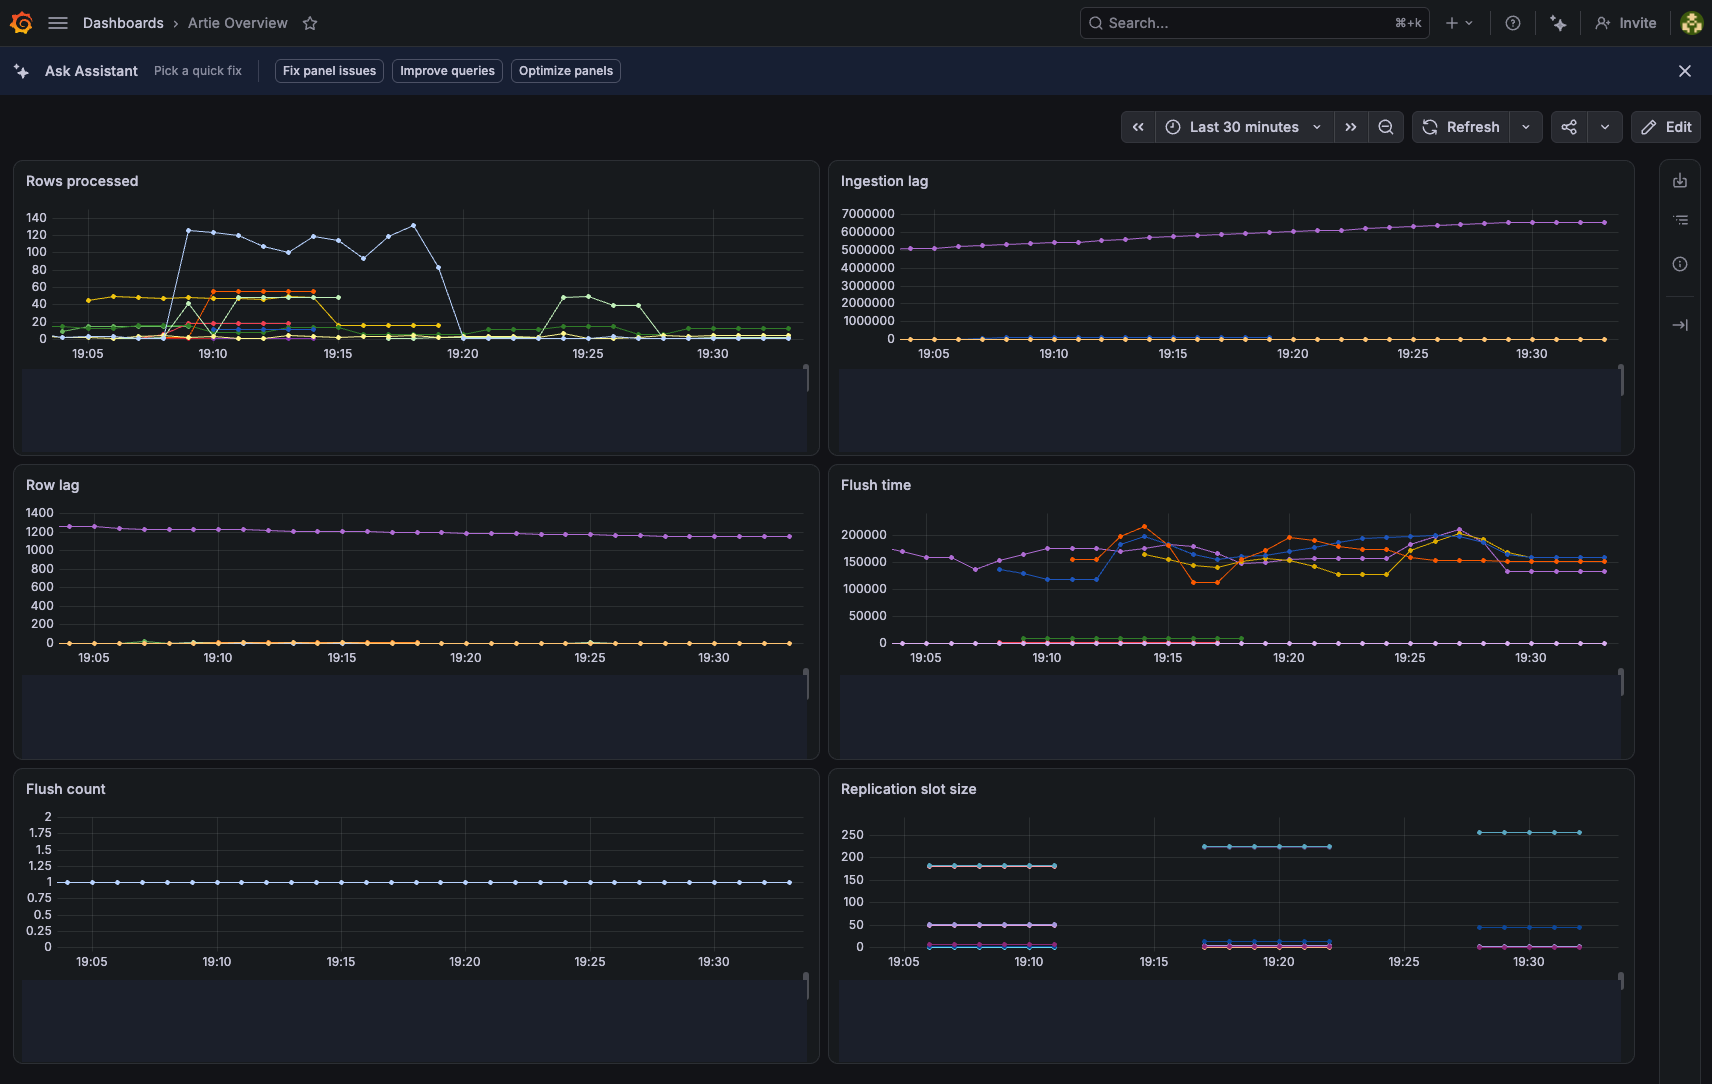
Artie’s Datadog integration dashboard organizes rows processed, performance, and database-health metrics. The Grafana dashboard uses the same six exported Artie metrics.- Download the Artie Grafana dashboard JSON.
- In Grafana, open Dashboards and select New > Import.
- Upload the JSON file, select the Grafana Cloud Metrics data source that receives Artie metrics for Prometheus, and select Import.
- Open the imported Artie Overview dashboard. It includes rows processed, ingestion lag, row lag, flush time, flush count, and replication slot size panels.
pipeline, table, operation, reason, and slotname. It includes no credentials, data-source URL, or customer identifiers.
Disconnect Grafana Cloud
In Settings > Integrations, select Disconnect Grafana. Artie stops future exports after the integration is disconnected. You can also revoke the access-policy token in Grafana Cloud.Limits
This integration supports Grafana Cloud Metrics only. It does not send logs or traces, and it does not support self-hosted Grafana or custom Prometheus-compatible endpoints.Table-level metric labels and Grafana Cloud costs
Table-level metric labels and Grafana Cloud costs
Artie preserves table-level dimensions from the Datadog integration. Each table can create additional active time series in Grafana Cloud. Review your Grafana Cloud plan and usage when connecting pipelines with many tables.
Troubleshooting
- Confirm that the remote-write URL uses HTTPS, ends in
/api/prom/push, and belongs to your Grafana Cloud Metrics instance. - Confirm that the Metrics instance ID and access-policy token are copied from the same Grafana Cloud stack.
- If metrics do not appear, disconnect and reconnect with a newly created write token.